DoodleMath: Math Help App for Kids
Personalized, standards-aligned online math practice designed by teachers for kindergarten through 5th grade.
DoodleMath: Math Help App for Kids
Personalized, standards-aligned online math practice designed by teachers for kindergarten through 5th grade.
DoodleMath: Math Help App for Kids
Personalized, standards-aligned online math practice designed by teachers for kindergarten through 5th grade.
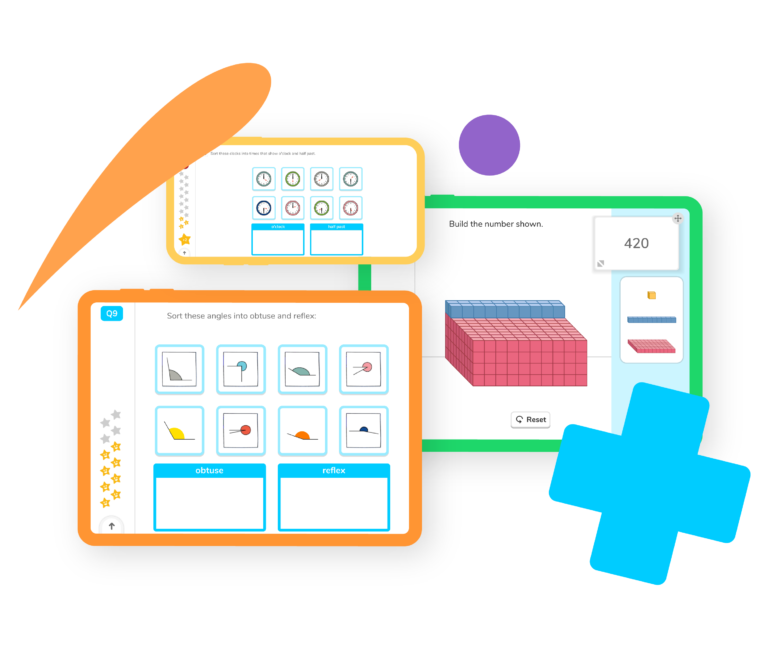
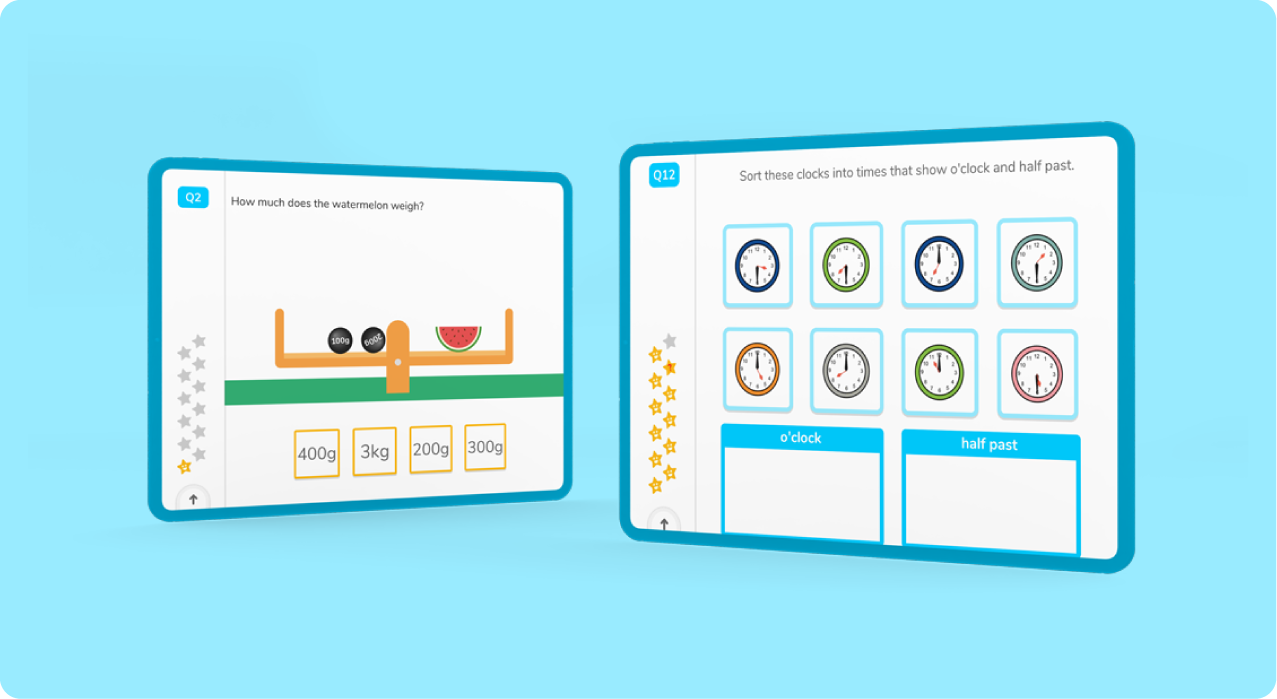
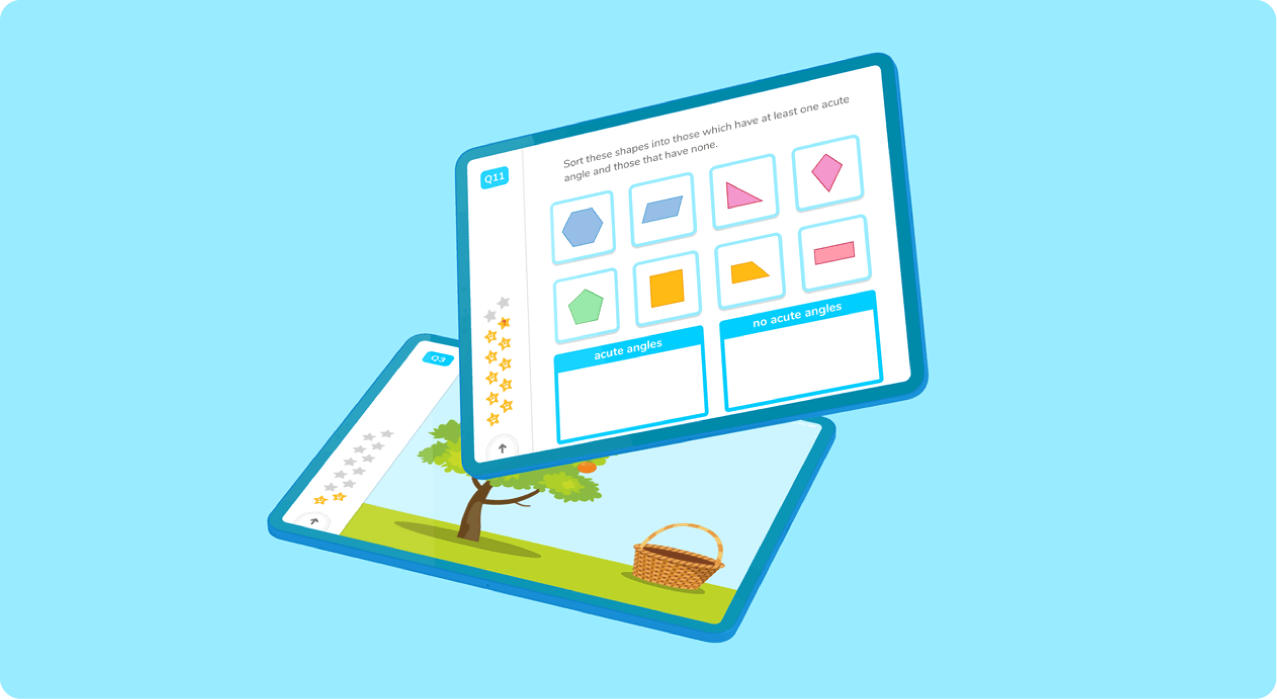
Doodle’s award-winning math app for kids helps students build confidence and fluency in math with standards-aligned, differentiated math practice. Filled with thousands of interactive math games and practice problems, the DoodleMath app enhances classroom instruction and learning at home by transforming math practice into a fun, rewarding adventure!
Why the DoodleMath App?
- Designed by teachers for families and educators
- Standards-aligned to K-5 math curriculum
- Personalized math practice unique to each child’s learning level
- Celebrates consistency over correctness
- Available on all devices – smartphone, tablet, and laptops
- Free 7-day trial
Why the DoodleMath App?
- Designed by teachers for families and educators
- Standards-aligned to K-5 math curriculum
- Personalized math practice unique to each child
- Celebrates consistency over correctness
- Available on all devices – smartphone, tablet, and laptops
- Free 7-day trial
Try DoodleMath for Yourself!
Select a year group
-
Counting
-
Operations
-
Base ten
-
Measurement and data
-
Geometry
-
Fractions
Benefits of Apps that Help with Math

Strengthened Math Skills and Fluency
Grounded in research and aligned to Common Core State Standards (CCSS), the DoodleMath solving app gives students the boost they need with individualized math practice that engages and provides personalized scaffolding and support.
Improved Math Confidence
Our math app for kindergarteners through fifth grade rewards effort over ability, empowering students to believe in themselves and growing a genuine love of learning math.

Instruction Support for Teachers
DoodleMath is a math resource for parents and teachers alike. Complementary to classroom curriculum, our math app for elementary students is designed to support classroom instruction by freeing up valuable time for teachers to inspire, differentiate and connect with students.

Fun and Approachable
The best math apps for kids are filled with interactive exercises, fun math games and unique rewards to ensure learning math is always fresh and engaging. DoodleMath does just that to encourage students to practice ‘little and often’ every day.

Easily Accessible
DoodleMath can be used on smartphones, tablets, laptops and desktops, letting students learn anywhere, anytime. If you are on a laptop or desktop, Doodle can be accessed offline.
Benefits of Apps that Help with Math

Strengthened math skills and fluency
Grounded in research and aligned to math Common Core State Standards (CCSS), our math solving app gives students the boost they need with individualized math practice that engages and provides personalized scaffolding and support.
Improved Math Confidence
Our math app for kindergarteners through fifth grade rewards effort over ability, empowering students to believe in themselves and grow a genuine love of learning math.
Instruction Support for Teachers
DoodleMath is a math resource for parents and teachers alike. Complementary to classroom curriculum, our math app for elementary students is designed to support classroom instruction by freeing up valuable time for teachers to inspire, differentiate and connect with students.
Fun and Approachable
The best math apps for kids are filled with interactive exercises, fun math games and unique rewards to ensure learning math is always fresh and engaging. DoodleMath does just that to encourage students to practice ‘little and often’ every day.

Easily Accessible
DoodleMath can be used on smartphones, tablets, laptops and desktops, letting students learn anywhere, anytime. If you are on a laptop or desktop, Doodle can be accessed offline.
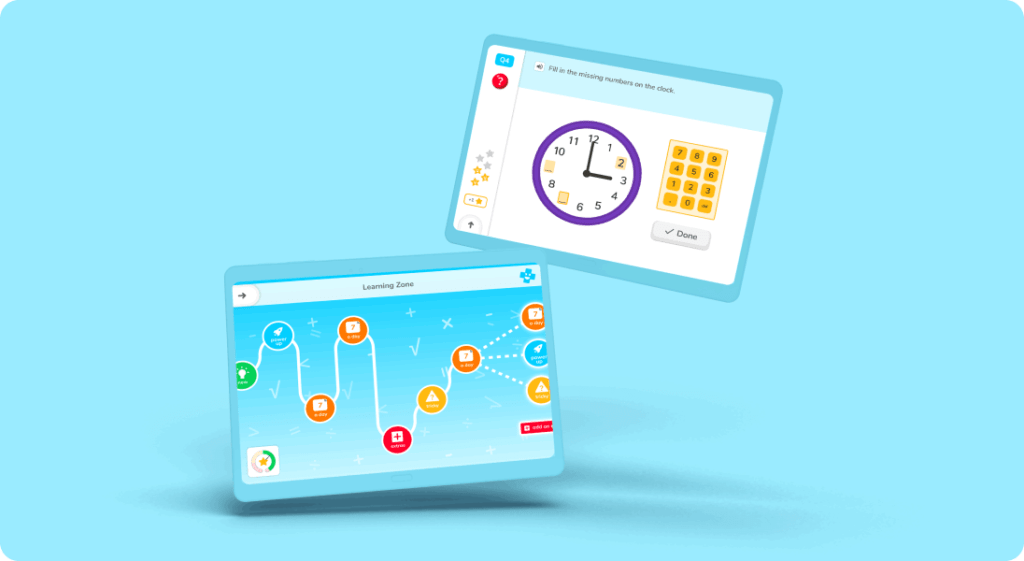
How the DoodleMath App Works
DoodleMath is the ideal personalized practice solution that supports teachers and parents as they work to build their student’s math fluency and love of learning. Aligned to the Common Core State Standards, our app for math help provides the same experience to students whether they are learning at school or at home but the backend experience varies for parents and teachers.
DoodleMath is a helpful learning tool for elementary students of all grades. Whether you are looking for a 2nd grade math app, 4th grade math app or anything in between, Doodle is here to help.
- Lets you easily set work in any topic of the curriculum, making it an ideal pre-teaching, lesson starter, or homework tool.
- Replaces worksheets, providing a rich learning experience while cutting down on time-consuming work like grading assignments.
- Identifies gaps in each student’s knowledge and builds upon what they already know, taking the practice off your hands.
- Provides practice at just the right level, enabling students of all abilities to work at their own pace in the classroom and at home.
- Tracks progress and provides actionable insights that saves teachers valuable time to plan, differentiate, and connect with students.
- Scaffolds learning through interactive questions that are supported by pedagogical research.
- Provides accessibility options such as audio-dictation supports diverse learners and enables all students to practice independently.
Chat with our team to discover how Doodle could benefit your school.

DoodleMath is the best math app for kids, transforming math into a fun and rewarding adventure! Whether you are looking for a 1st grade math app or math apps for 4th graders, Doodle is here to help.
- Replaces boring worksheets with interactive exercises, cool math games, and fun characters to keep learning math fresh and exciting.
- Boosts confidence by rewarding effort over ability so every student experiences ongoing success just by showing up.
- Features online math games, interactive math challenges, avatars, and virtual badges that motivate students to use our app for math help ‘little and often’.
- Allows students to set their own goals and earn stars for their hard work, taking ownership of their learning and encouraging independence.
Log in or sign-up to start Doodling today!

DoodleMath helps your child build math skills, confidence, and fluency through a personalized work program that complements school work.
- Serves elementary students of all ages. Whether you are looking for a 3rd grade math app or math apps for 1st graders, Doodle offers math help for kindergarten through 5th grade.
- Transforms screen time into a positive learning experience with as little as 20 minutes of use a day thanks to our engaging practice problems and unique math games for kids.
- Encourages independent learning by setting work at just the right level, enabling your student to work unaided.
- Breaks down math anxiety by gradually introducing topics in a fun and engaging way, boosting their love of the subject.
- Provides a range of accessibility options, such as audio-dictation, to help even less confident readers work independently.
Start a Free 7-Day Trial today.

What Real Doodlers Have to Say About DoodleMath
What Real Doodlers Have to Say About DoodleMath
What Real Doodlers Have to Say About DoodleMath
What Real Doodlers Have to Say About DoodleMath
FAQs About Our Math App
What is DoodleMath?
DoodleMath is a math app designed for elementary school students. The math problems featured in DoodleMath are tailored to your child’s age, grade level, and skill set. Designed by teachers and curriculum-aligned, DoodleMath is perfect for math practice at home.
How do I access DoodleMath?
You can download DoodleMath on your smartphone or tablet by visiting the App Store or Google Play. You can also sign up and access DoodleMath on your computer. Once you have an account, you can access it on any device.
Is Doodle a free math app?
There are many free math apps out there but not all personalize and scaffold learning. DoodleMath offers a free version with limited access. Otherwise, all paid subscriptions start with a seven-day free trial.
What age is Doodle for?
DoodleMath is designed for elementary students between the ages of 4 and 11.
What grade is best to use apps to help with math?
It’s never too early to start using a math answer app and DoodleMath is a great resource for elementary students of all ages. Since the program is tailored to your student’s age and skill set, it can be used as a kindergarten math app all the way up to a 5th grade math app.
What’s the difference between DoodleMath and DoodleMaths?
DoodleMaths is the UK version of DoodleMath! You may accidentally see DoodleMaths appear in Google but American users will want to download DoodleMath (without the “s”).